Impact At A Glance
The Need
Impact in College Costs
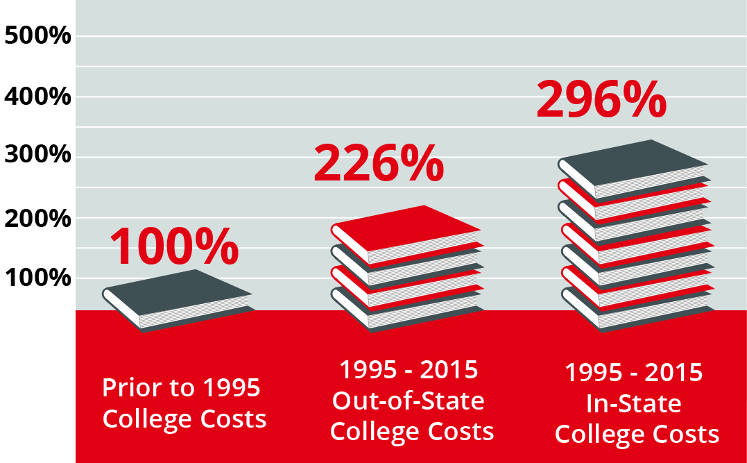
From 1995 to 2015, tuition and fees at public universities increased by a staggering 296% for in-state students and rose 226% for out-of-state students.
The Student Impact
Scholarships
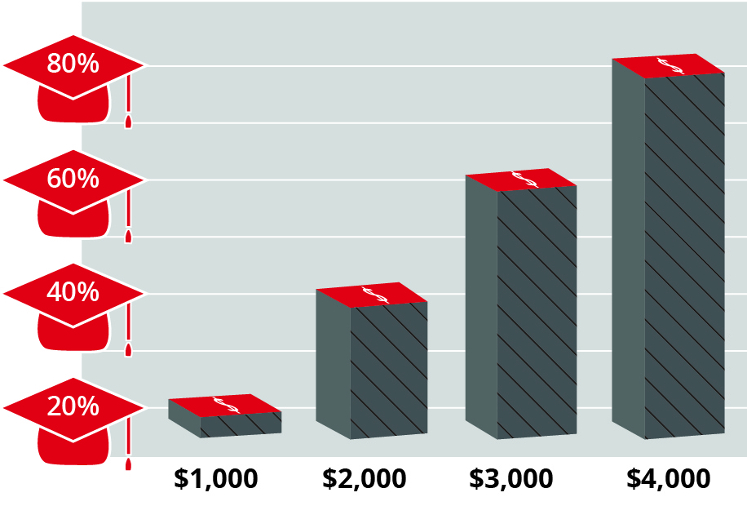
For every $1,000 put toward a scholarship, that student’s potential for remaining in school and graduating increases by 20%.
Student Loan Debt
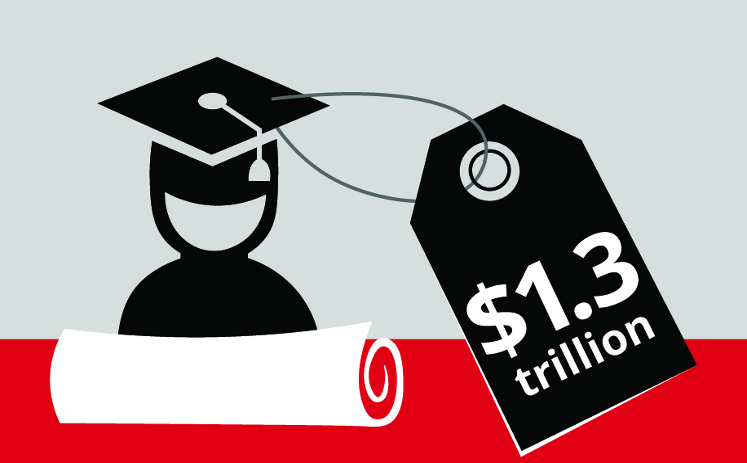
The cumulative student loan debt in the United States is $1.3 trillion and the average U.S. household carrying this type of debt owes around $50,000.
Higher Education Changes Lives
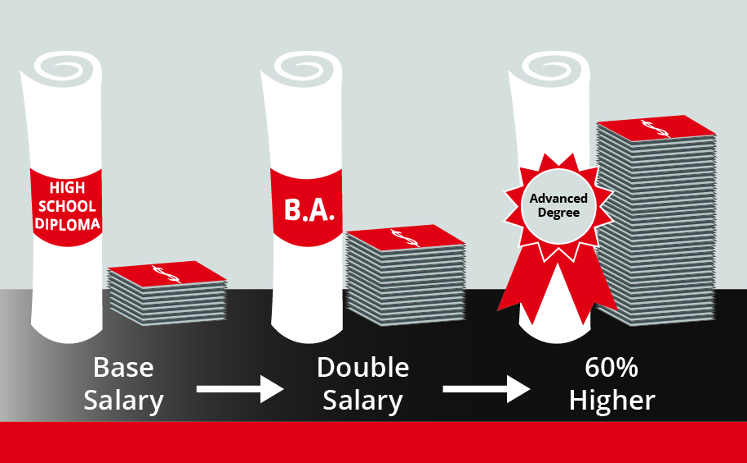
African Americans with a college degree earn more than double than those with only a high school diploma.
For Millennials ages 25 to 32 with a college degree, the average annual income is approximately $20,000 more than those with only a high school diploma… and the gap is steadily increasing.
Long-Term Impact
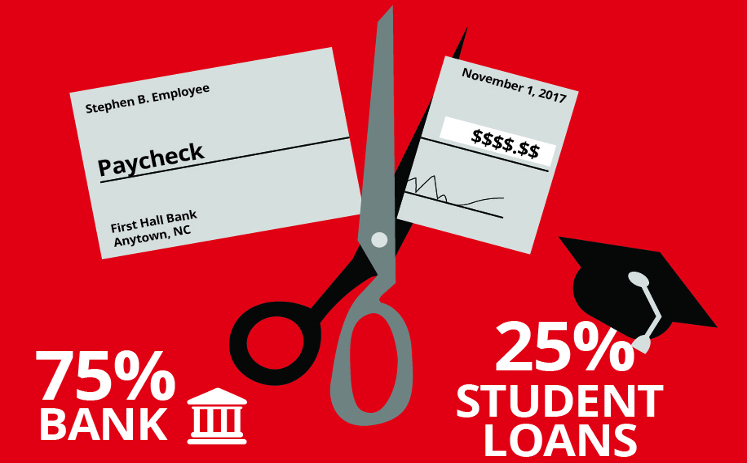
About 20% of households in the United States carry student loan debt.
1 out of 10 recent college graduates have monthly student loan payments that exceed 25% of their income.
The Important Role of HBCUs
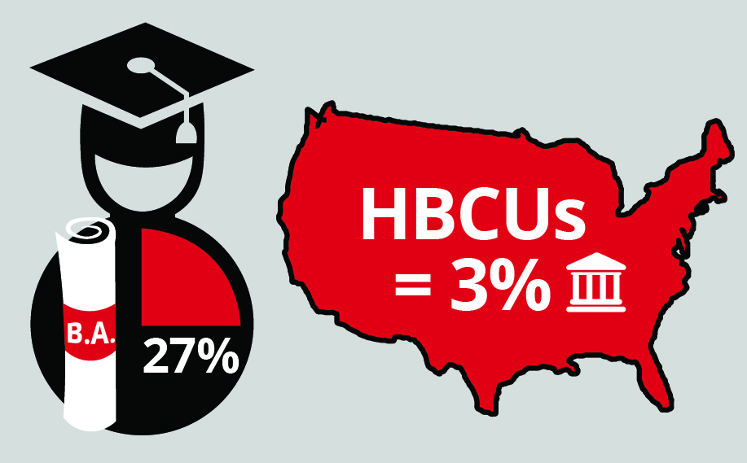
HBCUs are a small, but mighty, force. They produce 27% of African American students with bachelor’s degrees in STEM fields, yet only make up 3% of all colleges and universities.
WSSU Profile
Providing Graduates for In-Demand Fields
HBCUs produce 22% of all bachelor’s degrees in STEM fields earned by African American students.
